Using DMS Production Revamp
DMS Production Revamp brings line health, alarms, production support, glove handling, process performance and OEE into six plant dashboards. Use this guide to choose a dashboard, interpret its panels and open the detail views needed to investigate a result.
Audience: production, compounding, engineering and process owners. Coverage: the six dashboards in DMS REVAMP, their related drilldowns and Utility 360. Live review: 9 October 2026, Plant 7. Screens and integrated fields can differ by plant and available data.
This guide combines live screen checks with the Phase 1 user guide and functional specification, and the Phase 2 Production Part 1 specification V1.2. Where an interaction or chart could not be fully verified, it is identified below. Values seen during the review are examples, not current production readings or permanent targets.
1. Access and navigation
Links and screenshots: the dashboard links open Plant 7; drilldown examples identify their line and area. DMS access and sign-in are still required. Screenshots were captured on 9 October 2026 to identify controls and layouts. They are static examples, and their values, alarm durations and selected periods are not live readings. Use the live page for operational decisions. Select an image’s full-size link if its labels are too small.
Open DMS Foresight from a PC/network with access to Hartalega DMS. If a firewall authentication screen appears, complete it first; Foresight may then ask for its own login.
Select the required plant in the DMS entry workflow.
Open Production Module > DMS Revamped, or use the DMS Revamp navigation page for Plant 7.
Choose one of the six dashboard buttons. Confirm the plant and line context before using a reading. The links below open Plant 7; select another plant through the DMS workflow when required.
In a detail page, use its plant/line selectors where available. Select DMS REVAMP to return to the associated main dashboard. Browser Back also helps return to the navigation page.
Dashboard | Use it to answer | Open Plant 7 |
|---|---|---|
Production Line Health | Which lines are running, and which process areas need attention? | |
Alarm | Which alarms are active and how long have they been active? | |
Production Line Support | Are material supplies, utilities and centralized systems available? | |
Glove Handling | Where are losses occurring after dipping? | |
Process Insight | How are WIP, rejection, weight and utility efficiency trending? | |
OEE Insight | Is equipment effectiveness being limited by availability, performance or quality? |
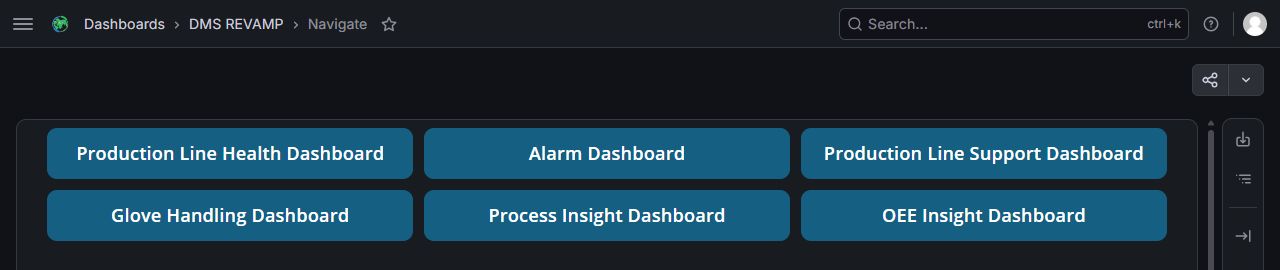
Figure 1. DMS Revamp navigation: the six dashboard buttons. Captured 9 October 2026. View full-size screenshot.

Viewing a control-room dashboard
Use a wide desktop display. These dashboards contain many line cards and can become crowded in a narrow browser pane. Collapse the Foresight menu to give the panels more space. Scroll inside the dashboard panel to reach lower rows or sections; some views have an additional page scrollbar. A clipped card does not mean its data is absent.
The supplied navigation URL includes a Grafana time range, but the embedded application panels use the data windows specified below. Do not assume that changing the outer Grafana range changes every embedded metric or opens historical data in a drilldown.
2. Read status and data correctly
Display | How to interpret it | What to check |
|---|---|---|
Green | Normally running, connected, in range or meeting the panel's rule. | Read the actual metric and its threshold; green rankings are relative comparisons. |
Red | May indicate a limit breach, bypass, breakdown, disconnection or missing data while a line is dipping. | Identify the panel and condition before concluding there is a physical process fault. |
Grey | May indicate Stop, No Demand, not in use, not applicable to the product, surgical-line exclusions or an integration gap. | Confirm line status and whether the metric is applicable and integrated. |
Dash or blank value | A value is unavailable or not applicable. It is not a measured zero. | Check the source, line applicability and connection status. |
Connection dot | The application's connection indicator is separate from the process value or line state. | A connected gateway does not prove that every metric has fresh, valid data. |
Panel-specific rules matter. Process loss/consumption metrics usually use an upper limit, while output and effectiveness measures are compared with targets. An equipment status tile also depends on whether the equipment should be operating. Read the relevant dashboard section below rather than applying a single colour rule everywhere.
Data windows and completeness
View | Specified window or update | Important limitation |
|---|---|---|
Line Health | Latest available values within the past 24 hours. | This does not guarantee every displayed value was acquired at the same instant. |
Alarm | Currently active alarms and their ongoing duration. | The main view is a summary; it does not list the full history of cleared alarms. |
Line Support | Latest available values within the past 48 hours. | Equipment and material fields depend on plant integration. |
Glove Handling | Latest available values within the past 24 hours. | Counts/rates and equipment states are different measures. |
Process and OEE Insights | Latest values, 30-day trends and a 30-day SMA where available. | An incomplete 30-day series can leave the SMA blank. |
OEE refresh | Hourly, according to Phase 2 V1.2. | This replaces the three-times-daily schedule described in Phase 1. |
Health/glove drilldowns | Up to 8,640 most recent points within the last 24 hours; no date/time picker specified. | Older/excess points are excluded. Chart rendering was not verified during this review. |
Utility 360 daily data | 7:00 am to 7:00 am the following day. | Daily production accounting differs from a calendar midnight-to-midnight day. |
The specifications exclude surgical-line data from the principal health, support, glove, process and OEE dashboards: those cards may be grey with empty values. Utility 360 provides a separate Surgical line-type option for Plant 7. The live Alarm page still displayed alarms for some line numbers whose other main-dashboard cards were grey; do not infer that a grey card proves there are no active alarms.
3. Production Line Health Dashboard
Open this page: Production Line Health Dashboard — Plant 7. Confirm the plant before interpreting the readings.
Start here for a plant-wide scan. Each row represents a line and aligns three sections: Line Status, Breakdown Status and Key Process Health.
What each section shows
Section | Fields | Interpretation |
|---|---|---|
Line Status | Connection indicator, line number, product name, Dipping/Bypass/Stop/N/A and line speed PV/SV in pcs/hr. | PV is measured speed; SV is set speed. Green generally indicates connected Dipping; bypass/disconnection is red and Stop is grey. |
Breakdown Status | Current breakdown or activity label and associated logs. | No breakdown and connected is green; breakdown/disconnection is red; No Demand is grey. When events exist, the specification alternates the label for 0.8 seconds and logs for 4 seconds. |
Key Process Health | Area tiles for cleaning, coagulant, ovens, latex, pre-leach, beading, cooling, chlorine, soak, neutralizer, rinse, coating and post-process equipment. | A tile summarizes its configured parameters. Red can mean out of range, disconnection or missing data while dipping. Stop/breakdown and non-applicable coating can produce grey tiles. |
Beading is a Phase 2 addition. It was present in the live view. The post-process strip includes GSR, Puller, ASM, APM and Vision; Phase 2 excludes these components from the health-parameter drilldown.
Investigate a red process tile
Example page: Line Health detail — Plant 7, Line 73, Cleaning Area. Change the selectors to your required context; this example does not automatically select the line currently under investigation.
Confirm the line number, product, connection indicator and whether the line is Dipping, Bypass or Stop.
Read the breakdown column. No Demand greys the line columns except connection; disconnection can make other columns red.
Select the relevant process-area tile to open its parameter drilldown. The live review verified entry to the Line Health Params Drilldown for Plant 7, Line 73, Cleaning Area.
Use Plant No., Line Number and Area to confirm or change context. Use DMS REVAMP to return.
If the chart area is blank, follow the troubleshooting section. Use the Alarm Dashboard and existing source-system views to confirm the condition.
Specified drilldown charts
The Phase 2 specification describes PV line charts with control limits and equipment-state heatmaps. A red parameter status box identifies the latest out-of-range PV or equipment that is Off while dipping. Heatmaps use green for On, red for Off while dipping and grey for Off. Charts should include only parameters with the required data source and defined alarm/limit condition; an absent parameter is not proof that it is healthy.
Verification limit: the drilldown selectors and return link loaded, but the embedded chart area remained blank in the reviewed session. The chart types, control-limit styling, scrolling and 8,640-point limit above are specification-based, not confirmed rendered behaviour.
4. Alarm Dashboard
Open this page: Alarm Dashboard — Plant 7. Confirm the plant before interpreting the readings.
Use this view to identify current alarms and their persistence. The main page combines total active alarm count, line/utility alarm cards, the longest-running alarm and a long-running list.
Panel | Reading rule |
|---|---|
Alarm Count | Total active alarms for the selected plant. |
Line / utility card | Shows its active count and the five longest-running active alarms, ordered longest first. Labels without active alarms are omitted. A count larger than five is expected. |
Alarm columns | Alarm name, PV, LCL, UCL and Duration. A discrete equipment-state alarm may have no numerical limits. |
Longest Running Alarm | The longest active duration. The user guide specifies a maximum displayed duration of 29 days 23 hours. |
Long Running Alarm | Active alarms lasting more than two hours, ordered longest first. The specification limits the list to 50 entries and the card/list count display to 99. |
Durations use days (d), hours (h), minutes (m) and seconds (s), normally showing the first two non-zero units, for example 1d 5h or 3h 4m. Numeric PV/LCL/UCL values are specified to one decimal place. Utility groups listed in the Phase 1 specification include scrubber, chiller, compressor and boiler.
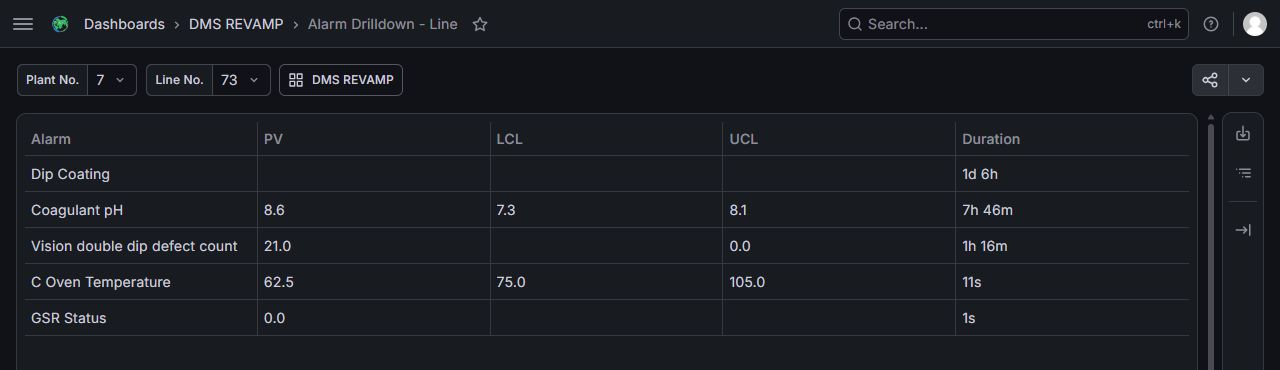
Figure 2. Line Alarm detail: Plant and Line selectors, DMS REVAMP return button, and Alarm / PV / LCL / UCL / Duration columns. Plant 7, Line 73 example. Captured 9 October 2026. View full-size screenshot.

Open the complete line alarm list
Example page: Line Alarm detail — Plant 7, Line 73. Change the selectors to your required context; this example does not automatically select the line currently under investigation.
Select a line label on its alarm card.
On Alarm Drilldown - Line, confirm Plant No. and Line No..
Read the full alarm grid: Alarm, PV, LCL, UCL and Duration. The live line detail included an alarm beyond the main card's five entries.
Use the column-header controls if you need to reorder the grid, and confirm the resulting order.
Select DMS REVAMP to return to the Alarm Dashboard.
Line drilldown navigation and the populated grid were verified live. The Phase 2 specification also describes a utility drilldown with a Plant No./Utility selection; a utility detail page was not tested because the reviewed main view had no utility card to open. This guide does not establish an alarm acknowledgement or clearing procedure.
5. Production Line Support Dashboard
Open this page: Production Line Support Dashboard — Plant 7. Confirm the plant before interpreting the readings.
Use this dashboard to trace a production concern back to material supply, engineering utilities or centralized services. Read the line-to-tank mapping before interpreting the tank status: one shared tank can affect several lines.
Compounding status
Supply | Read these fields | Key interpretation |
|---|---|---|
Latex | Line, Supply Tank, Level (cm), Latex Type, pH and TSC (%), where integrated. | Each line has its dedicated supply relationship. Green means the tank/line supply condition meets the rule; a low/invalid level or non-dipping line can change status. |
Coagulant | Line-to-tank assignment; tank CN Type, Level (cm), CN (%), pH, MRA Type and MRA (%) where present. | A tank can supply several lines. The specification allows up to four active supply tanks in the view. |
Coating | Line-to-tank assignment; coating type, Level (cm), Supply Temp (°C), pH, Age and TSC (%). | Check level, temperature and whether the supplied coating matches the product. No coating required for the product can be grey. Up to four supply tanks are specified. |
Do not substitute a dash with zero or presume a supply tank is empty. The live view contained integrated latex pH and MRA (%) fields as well as gaps in other tank and utility measurements. Field availability varies with integration.
Utility and centralized-system status
Group | What it shows | How to use it |
|---|---|---|
Boiler / COGEN / HE | Equipment statuses; leaching supply temperature/pressure; closed-loop supply and return temperature/pressure. | A standby unit can be grey while another unit supplies the service. Check the relevant equipment group rather than treating every grey unit as a fault. Plant equipment mappings differ. |
Compressor | Compressor status and supply pressure in bar. | Check the available units and pressure readings together. |
Chiller | Chiller status and supply temperature in °C. | Compare the measurement with the configured limit; a running unit can still have an alarm. |
Chlorine Supply | Bank A/B status and line dosing rate (kg/hr), supply temperature (°C) and age (days), where integrated. | Unavailable fields require source/integration checks. |
Centralized Acid / Alkali | Diluted tank status, level (cm), supply strength (%) and supply pressure (bar). | Look for a shared supply issue affecting several lines. |
Acid Neutralizer | Storage tank status/level and supply pressure, where integrated. | Confirm data availability before drawing a supply conclusion. |
Suggested investigation: identify the affected line, find its supply tank, check the tank's material and readings, then compare related utilities and other lines sharing that supply. Cross-check the Alarm Dashboard for the same equipment. The live review verified these support panels and unit labels; it did not establish a separate support drilldown.
6. Glove Handling Dashboard
Open this page: Glove Handling Dashboard — Plant 7. Confirm the plant before interpreting the readings.
Each line card combines a large Net Output gauge, Post Process Health, Vision & Rejection System Pass Rate, pack size and loss components. The live net-output gauge uses pcs/hr, while breakdown labels in the main cards show percentages.
Measure | What to inspect |
|---|---|
Net Output | Net gloves produced per hour and the pack size in pcs/box. This is a rate, not a shift-total quantity. |
Post Process Health | Its gauge and GSR Miss Strip, ASM/Puller Throw Out and APM Packing Reject Rate. |
Vision & Rejection System Pass Rate | Its gauge and Stain, Tear, Double Dip, Former Defect and Former Missing components. |
Connection / equipment status | Read independently of the loss value. A machine expected to run while the line is dipping can be flagged even when its count is missing. |
Phase 2 thresholds
These values come from Phase 2 V1.2, pages 23-25. They describe the specified rules, not a confirmation of every deployed comparison. Percentage-derived loss limits use the line speed SV as their count basis.
Item | Specified target / upper allowance |
|---|---|
Net Output | At least 99.3% of line speed SV. |
Post Process Health | 99.8% reference target; the specification expresses its threshold using line speed SV despite displaying a percentage. |
Miss Strip | Up to 0.03% of line speed SV; red also when the line runs but GSR does not. |
ASM Throw Out | Up to 0.17% of line speed SV with AI Vision, or 0.67% without AI Vision; red also when the line runs but Puller and/or ASM do not. |
Vision & Rejector Pass Rate | 99.5% reference target; its threshold wording also refers to line speed SV. |
Vision Stain / Tear / Double Dip | A cumulative allowance of 0.5% of line speed SV with AI Vision; unavailable without AI Vision. Vision not running while the line runs is also a red condition. |
Packing Reject / Former Defect / Former Missing | No threshold defined in the Phase 2 table; some items are explicitly grey. |
Threshold caveat: the live review showed green aggregate gauges at values below the Phase 2 reference percentages. Do not use this table to reconstruct deployed pass/fail logic without confirming configuration with the system owner.
Open a line detail and change units
Example page: Glove Handling detail — Plant 7, Line 73. Change the selectors to your required context; this example does not automatically select the line currently under investigation.
Select the line's Net Output gauge to open Glove Param Drilldown; this entry was verified for Line 73.
Confirm Plant No. and Line No..
Choose Parameter: pcs/hr or %/hr. Both options and a successful change to %/hr were verified.
Use DMS REVAMP to return to Glove Handling.
The Phase 2 design specifies stacked bars for component losses, a switch to grouped bars, upper-limit lines, status boxes and equipment-state heatmaps. It applies the last-24-hours/8,640-point limit and provides no date/time picker. The embedded charts remained blank during the review, so the stack/group switch, heatmaps and chart scrolling are specification-based features.
For investigation, confirm that the line is dipping and connections are valid, compare the two aggregate gauges, then identify which loss component is high or unavailable. Avoid adding percentages or treating missing components as zero. The Phase 2 specification also changes plant-specific Miss Strip and ASM Throw Out source calculations; see section 3.3.2.1 of that specification for reconciliation.
7. Process Insight Dashboard
Open this page: Process Insight Dashboard — Plant 7. Confirm the plant before interpreting the readings.
This view combines WIP inventory, plant metrics, line comparisons and 30-day charts. It is useful for identifying persistent losses or consumption changes and then finding the contributing lines.
Read the layout
WIP row: WIP, TMP, Non SP Qmax, Non SP Cell and WIP in Transit, in million pieces. Each card shows the latest cumulative value and its available trend. The baseline specification defines no WIP threshold; the reviewed cards displayed a dash for threshold.
Plant metric card: latest value, 30d SMA, threshold, a miniature trend and best/worst line lists.
Line cards: each line's latest value and miniature trend for the same metric. Grey/empty surgical or unavailable cards can remain visible.
Metric | Unit / comparison |
|---|---|
Glove Overweight | %; Phase 2 threshold 0. The live Plant 7 view also displayed 0. Negative values are possible in the displayed metric; confirm the underlying weight calculation before interpreting them as a quality result. |
Online Rejection | %; Phase 2 threshold 0.5, also displayed in the reviewed Plant 7 view. |
Burner Gas Consumption | mmBTU/kpcs; compare with the plant's configured utility threshold. |
HW / RW Consumption | m³/kpcs for hot water / raw water. |
Electrical Consumption | kWh/kpcs. |
For these loss/consumption measures, values above the configured upper threshold are red. Plant utility intensity is calculated from total usage divided by total glove output, multiplied by 1,000; it is not simply the average of line intensities.
Rankings: best/worst lists are relative rankings, not separate compliance decisions. The specification places all available lines in Best when fewer than four lines have data; otherwise it shows the best three and up to three worst. Missing 30-day observations can leave SMA blank even when Latest is available.
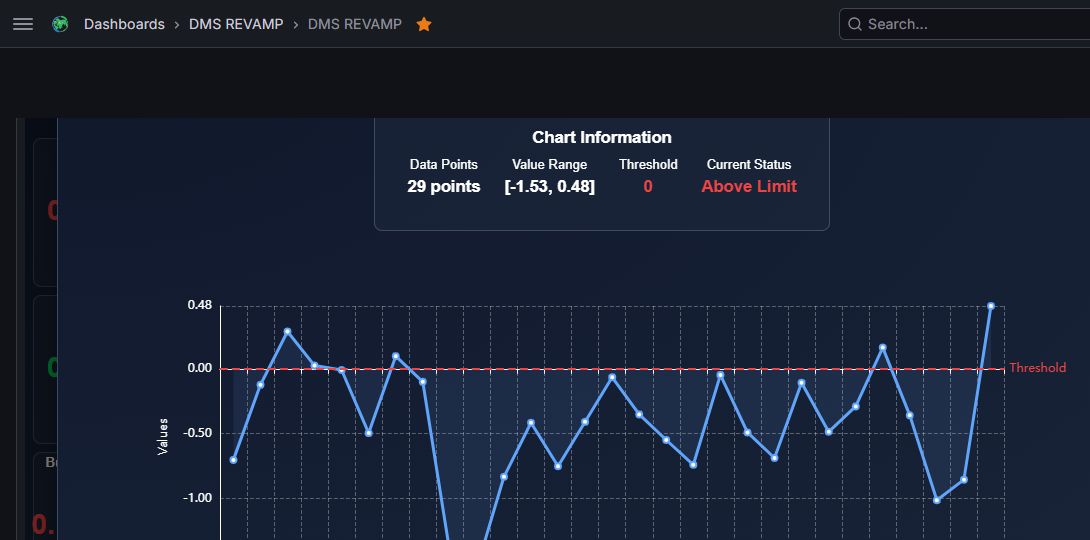
Figure 3. Expanded Glove Overweight trend in Process Insight: Chart Information, actual trend and red threshold line. Plant 7 example; the cropped view shows the chart content. Captured 9 October 2026. View full-size screenshot.

Enlarge a trend
Click a miniature trend chart in a plant or line card.
Confirm that the pop-out title identifies the intended metric and PLANT or LINE context.
Read Chart Information: Data Points, Value Range, Threshold and Current Status, alongside the enlarged graph.
Select Close to return. If the button is below the visible area, scroll within the panel. Escape closed the reviewed Process chart overlay.
The plant Glove Overweight pop-out and its chart information were verified live. The same Phase 2 design provides enlarged plant and line trends. A chart can contain fewer than 30 points when source data is incomplete.
Open Utility 360
Click a utility metric label, rather than its miniature chart, to enter Utility 360. Clicking Burner Gas Consumption (mmBTU/kpcs) opened Plant-Level Utility Usage PTP during the review. Use the workflow in section 9 to analyse year, month, day and line.
8. OEE Insight Dashboard
Open this page: OEE Insight Dashboard — Plant 7. Confirm the plant before interpreting the readings.
OEE Insights separates effectiveness into OEE, Availability, Quality and Performance. Each row includes plant results, latest values, 30d SMA, targets, rankings and line trends. Phase 2 specifies hourly updates and the main view uses a 30-day trend window.
Measure | Meaning in the supplied specification |
|---|---|
Availability | Line uptime with QI divided by planned hours, expressed as a percentage. |
Performance | (Glove Output + Online Rejection) ÷ (Line Uptime with QI × Line Speed) × 100%. |
Quality | [Glove Quality quantity − (Reject Pcs + 2G Pcs + Rework Pcs + Online Rejection)] ÷ (Actual Output + Online Rejection) × 100%. |
OEE | Availability × Quality × Performance, using fractional factors. With all inputs entered as percentages, OEE (%) = Availability (%) × Quality (%) × Performance (%) ÷ 10,000. |
Plant factors use sums of the underlying quantities across lines, rather than an unweighted average of each line's percentage. The source specification uses the term “uptime with QI”; its operational definition should be confirmed with the reporting owner when reconciling calculations. Phase 2 V1.2 adds the subtraction in the Quality numerator and supersedes the earlier formula for that enhancement.
Investigate an OEE change
Compare plant Latest and 30d SMA with the displayed target.
Check Availability, Performance and Quality to identify the contributing factor.
Compare line cards and relative rankings for that factor. A high relative rank can still miss the target.
Click the plant or line miniature trend to enlarge it; verify the metric/context in the title and read chart information.
Use Close to return, then cross-check Line Health, Alarm, Glove Handling or Process Insights as appropriate.
Targets come from the configured Hartalega financial-year OEE targets. Do not reuse the Plant 7 values from a screenshot as targets for another plant or year. Performance values above 100% occurred in the reviewed view; validate source quantities and the configured speed basis before rounding or capping them.
Known OEE status inconsistency
The live plant OEE pop-out displayed a red Above Limit status when the main plant OEE tile was green and its Latest value exceeded the displayed target. The supplied OEE colour tables also describe an upper-limit comparison. These signals should not be treated as a consistent OEE target rule. Compare the number with the approved target and confirm the intended comparison with the system owner; do not conclude that exceeding an OEE target is a failure solely from the pop-out label.
9. Utility 360: consumption per thousand pieces
Utility 360 expands the consumption metrics into fiscal-year, monthly, daily and line analyses. “ptp” and “kpcs” refer to a per-thousand-piece basis in this documentation. Raw utility consumption and normalized consumption are different quantities: an intensity can rise when output falls even if total usage stays constant.
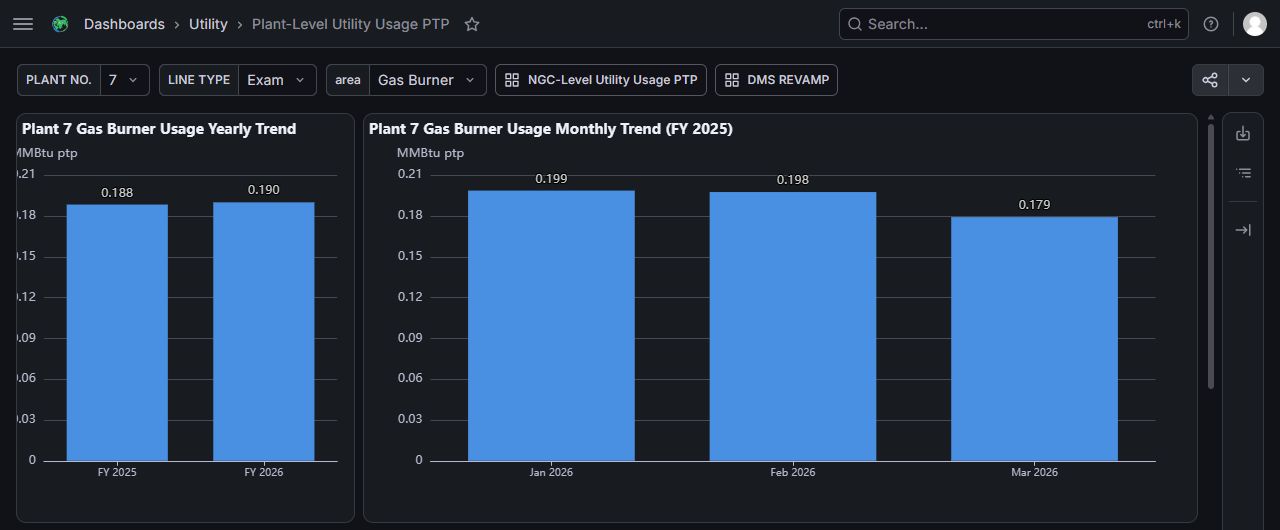
Figure 4. Utility 360: Plant, Line Type and area selectors; NGC and DMS REVAMP navigation; yearly and monthly charts. Plant 7 Gas Burner example with a saved FY2025 selection. Captured 9 October 2026. View full-size screenshot.

Plant-level workflow
Example page: Utility 360 — Plant 7, Gas Burner. Change the selectors to your required context; this example does not automatically select the line currently under investigation.
From Process Insights, click the utility metric label. Confirm PLANT NO. and LINE TYPE.
Use area to select Gas Burner, Hot Water, Raw Water or DPM. These four live option labels were verified. The specification describes the fourth metric as electrical consumption in kWh/ptp; the reviewed menu names it DPM.
Click a year bar in Usage Yearly Trend to change the year. The live gas view uses FY labels; April-to-March fiscal-year boundaries are reflected in the charts.
Click a month bar in Usage Monthly Trend to filter the daily trend. Year and month filtering were tested live.
According to the specification, click a day bar to update the usage-by-line panel, then select a line bar to view that line's daily trend for the chosen month. These day/line interactions were not tested during this review.
Check the headings and selected date after each step. A saved link can start with an older year/month/date; do not assume the initial view is today's data.
Use DMS REVAMP to return to Process Insights.
The specification limits Surgical selection to Plant 7. Exam was verified as the live selected line type; Surgical selection was not exercised. The observed plant view displayed year, month, daily and line charts with red upper-threshold lines and red daily/line bars above the threshold.
NGC-level workflow
Example page: NGC-Level Utility Usage PTP — Gas Burner. This example carries the saved FY2025 / March 2026 selection. Choose the required period after opening it, or use the NGC link in your current plant utility page to carry that page’s context.
Select NGC-Level Utility Usage PTP from the plant view. The NGC page and its area selector, Plant-Level return link and DMS REVAMP return link were verified. The Phase 2 design describes selecting year, then month, then plant to reach the chosen plant's daily trend. NGC chart filtering was not tested during this review.
Calculations and targets
Line daily intensity: daily usage ÷ daily glove output × 1,000.
Plant/month/year intensity: sum usage ÷ sum glove output × 1,000 over the applicable lines and days. Use the totals ratio, not an average of daily ratios.
Gas conversion in the specification: gas volume (m³) × 5.018 × 0.036 = MMBtu.
Other units: hot/raw water m³/ptp and electrical kWh/ptp. Values are specified to three decimals.
Data exclusion: records with zero Daily Usage or zero Daily gloveOutput are removed from the calculation and not displayed, according to Phase 2.
Threshold selection: plant, line type and financial year can change the target. Phase 2 defines fallback to the preceding financial year's threshold if the current year's is unavailable; if neither exists, no threshold is displayed.
The supplied threshold table is explicitly for FY2025 (1 April 2025 to 31 March 2026). It should not be presented as a permanent or independently verified FY2026 target list. Read the configured threshold on the selected live view and confirm the applicable approved target when reporting a variance.
10. Troubleshooting and verification notes
Symptom | Check / next step |
|---|---|
Login page keeps loading | Open the original DMS or PRT URL in a fresh tab in the same browser session. During this review that exposed a completed PRT login and DMS's second Foresight login. Enter credentials directly in the browser. |
Health or glove detail is blank | Confirm plant, line and area/unit context. Return through DMS REVAMP and reopen the detail. The review found blank embedded charts despite loaded selectors. Check the main dashboard, alarms and source-system data; report the affected URL/context and time to the DMS support owner. |
A field is a dash, grey or missing | Check whether the line is stopped, surgical, not in use or the product does not need that process. Then check integration and connection. Do not replace missing data with zero. |
A dipping line is red but no value is visible | Red can flag missing data or disconnection. Check the connection indicator and Alarm detail before diagnosing a physical limit breach. |
Alarm count exceeds the visible list | The main card shows only five alarms. Open the line detail to inspect the fuller list; long-running lists also have display limits. |
Latest exists but 30d SMA is blank | The specified SMA requires a complete 30-day series. Check historical data completeness. |
OEE tile and pop-out status disagree | Use the numerical value and approved target. The reviewed overlay used a red Above Limit label while the main tile was green. Ask the owner to verify comparison direction. |
Glove gauge colour disagrees with a specification percentage | Confirm deployed thresholds and the count-versus-percentage basis. The reviewed aggregate colours did not consistently match the Phase 2 reference targets. |
Utility charts show an unexpected period | Check fiscal year, month and date in chart headings. Click the desired year/month and confirm dependent panels updated. Saved URLs may preserve old defaults. |
Cards overlap or appear cut off | Use a wider browser window, collapse the main menu and scroll inside the embedded panel. Recheck whether data is simply outside the visible region. |
When raising a discrepancy, include dashboard name, plant/line, metric, selected period, expected target, displayed value/status and observation time. Avoid changing process settings based solely on a dashboard colour. This guide documents monitoring and navigation; it does not replace the approved operating or maintenance procedures.
11. Glossary and reference basis
Term | Meaning |
|---|---|
PV / SV | Process Value / Set Value. |
LCL / UCL / CL | Lower Control Limit / Upper Control Limit / Control Limit. |
SMA | Simple Moving Average; 30d SMA is the average over the specified 30-day series. |
OEE | Overall Equipment Effectiveness. |
WIP / TMP | Work In Progress / Temporary Pack. |
Non SP Qmax / Non SP Cell | Non-Straight Pack Quality Maximum Rework / Non-Straight Pack Light C Table Cell, as named in the supplied user guide. |
HW / RW | Hot Water / Raw Water. |
pcs/hr / pcs/box / mil pcs | Pieces per hour / pieces per box / million pieces. |
kpcs / ptp | Thousand pieces / per thousand pieces. |
NG / N/A | Not Good / Not Available or not applicable in the relevant screen context. |
MIS / LTMS / CRS | Management Information System / Lab Test Management System / Centralized Reporting System. |
SPC / PCC | Statistical Process Control / Process Control Checklist. |
CAA / HE / COGEN | Centralized Acid Alkaline / Heat Exchanger / cogeneration equipment. |
Source documents
USER GUIDE - DMS_Revamped_User_Guide - v1.0.pdf, V1.0, 13 October 2025. Access and overview: pages 4-7; dashboard guidance: pages 8-26.
FS - DMS Revamped - Functional Specification_V1.0 1.pdf, V1.0. Line Health: pages 8-21; Alarms: pages 22-24; Line Support: pages 25-35; Glove Handling: pages 36-39; Process Insights: pages 40-43; OEE: pages 44-46; formulas: pages 47-48. The cover and revision/sign-off dates differ; version is the reference used here.
FS - DMS Revamped 2 - Production 1 - Functional Specification_V1.2_Signed.pdf, V1.2, 3 December 2025. Enhancements: pages 9-31; health drilldown: pages 32-35; alarm drilldown: pages 36-38; glove drilldown: pages 39-43; enlarged insights: pages 44-47; Utility 360: pages 48-57. The sign-off table contains a V2.0 title string; the supplied file, cover and revision history identify V1.2.
How sources were applied: Phase 1 provides the baseline rules. Phase 2 describes additions and changes; unchanged details retain the Phase 1 basis. Live observations establish the controls and behaviours described as verified. Specification-only details and observed discrepancies are labelled explicitly, rather than silently assuming that every planned feature is working.
Verification scope: all six Plant 7 main pages, line alarm drilldown, glove unit selector, health detail selectors, plant Process/OEE chart pop-outs, Utility 360 entry, plant year/month filtering and NGC navigation. Other plants, surgical selection, utility alarm detail, health/glove chart rendering and Utility 360 day/line/NGC filtering require further validation. Review this guide after dashboard or threshold changes.